Tracking our Impact
Since 1999 …
total meals distributed
average pounds rescued
per day
average donors per month
average recipient agencies
per month
Aloha Harvest Partners Map
View Aloha Harvest’s impact and browse the partners that are helping us to reduce food waste and feed the community! 🚛💙💚
“Active Food Donors” are partners that we have picked up rescued excess or donated food from within the last 180 days as of July 5th, 2026.
“Active Recipient Agencies” are partners that we have delivered and donated food to within the last 180 days as of July 5th, 2026.
(Tip: You can click the “v” dropdown icon under each toggle group and see all partners’ names listed alphabetically.)
Data Dashboards
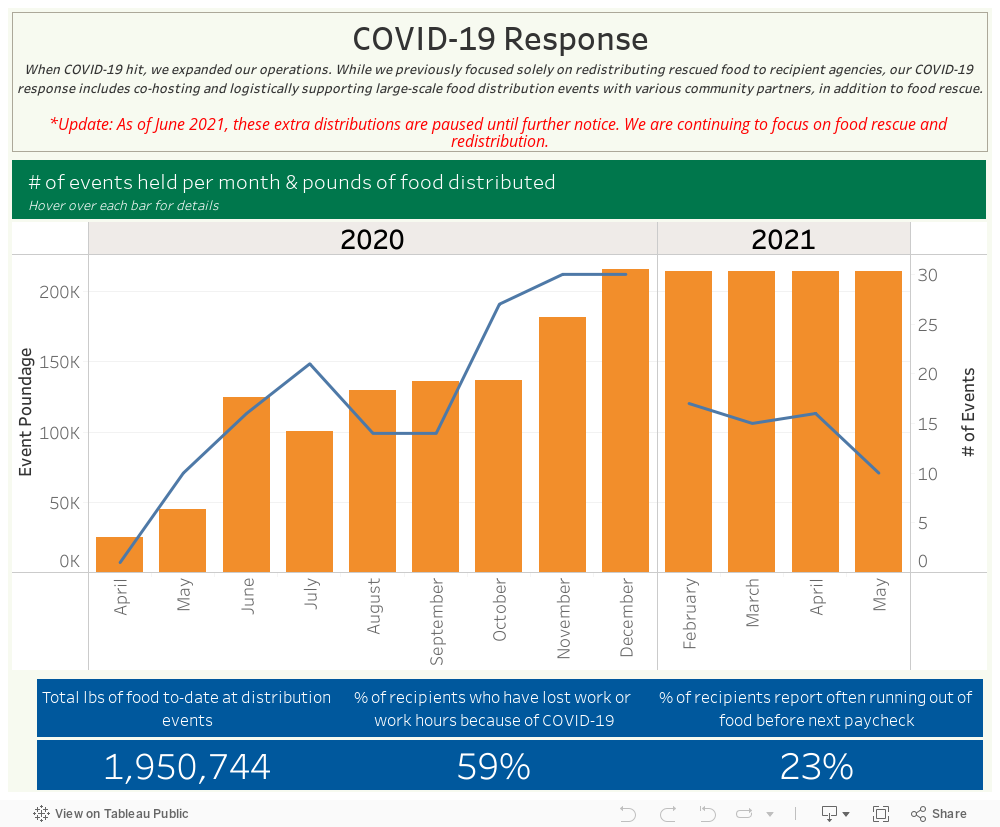
Explore our food rescue data with the interactive dashboard set below! These visualizations allow you to filter according to time periods, regions, and other criteria to discover new insights about Aloha Harvest’s mission to redistribute excess food and feed the hungry of Hawai’i. The dashboards are sorted from largest scope (historical data from 2010-present) to our most recent efforts to redistribute food during the COVID-19 pandemic. Besides using the month and year filters to explore, you can also hover your cursor over graphs to view new insights and figures. Press the “escape” button to reset any dashboard. All dashboards can be downloaded in PDF or JPG format, and metadata can also be downloaded. Just click the second-to-last icon on the bottom right of the dashboard. It has a rectangle with an arrow pointing downwards. Several options will appear on your screen for download options. For best viewing experience, we recommend maximizing the boards by selecting the icon on the far bottom right of each dashboard.
You can also view the video below for a visual demonstration of how to interact with the dashboards. Mahalo and happy exploring!
Historical data
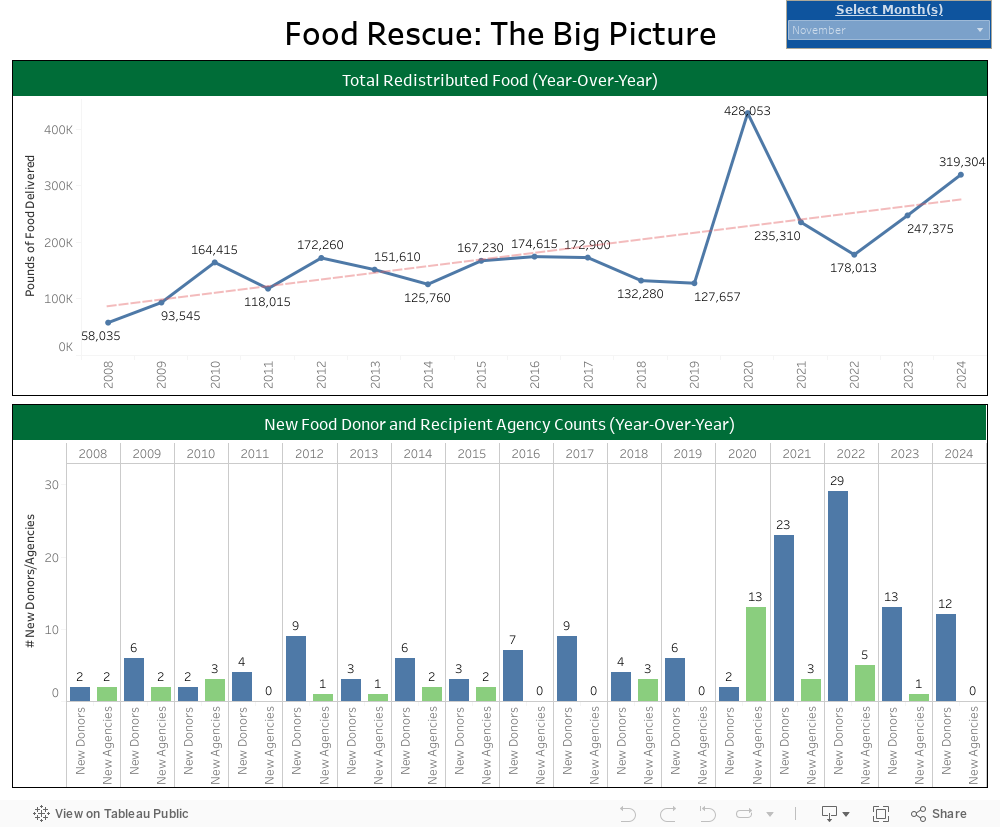
Note: Due to availability and methodological differences in monthly data collection prior to 2007, only data after 2008.
This year
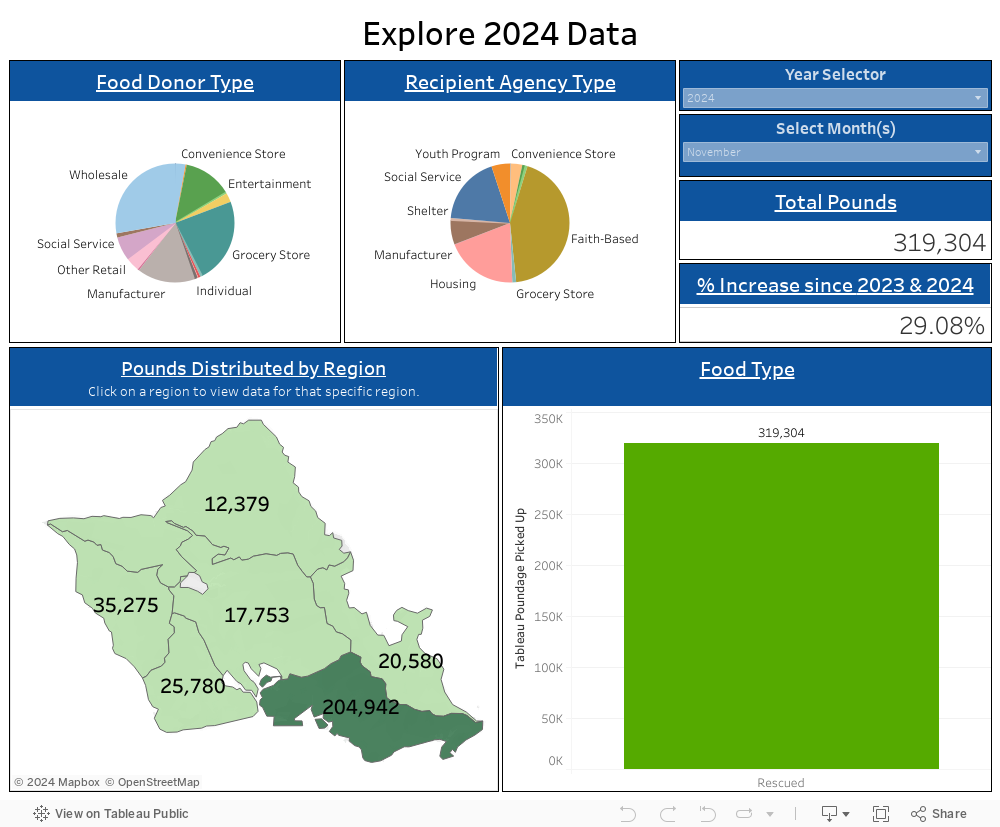
Note: These figures are presented month by month rather than being easily transformable into aggregate forms for data agreement reasons.